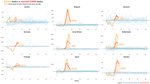
Revisiting normality tests in Python
How could we easily check the normality of a given variable? .
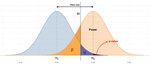
A/B Testing Made Simple: Beginner’s Guide to Understanding the Statistics
Understanding pvalue, error types, and statistical power
Analyzing data from COVID19 R package
Does reported deaths match actual deaths?
10 Tips to ace your Kaggle, Datathon or any data competition!
Do you want to achieve your goals?

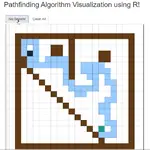
Pathfinding Algorithms Visualizer using R! (I) Setting up the interactive grid
Setting up the interactive grid with Shiny and ggplot! Trail with some kind of random-walker algorithm.
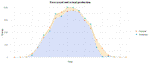
Time Series Forecasting: Error Metrics to Evaluate Model Performance
8 Forecast error metrics you should know to evaluate the accuracy of your time series models. Find metrics that are aligned with your business goals.
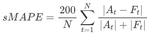
Symmetric MAPE is not symmetric
Against all odds, it isn’t
Turn your GGplot to 3D animation. Awesome 2D to 3D plots in R with Rayshader
Do you want to add a 3rd dimension to your R plot? In this post we show you how to turn your R ggplot to a 3D plot easily with Rayshader.