Shadowing your Plotnine lines in Python. Forecasting confidence interval geom_ribbon.
Plot your confidence interval easily with Python! With plotnine geom_ribbon() you can add shadowed areas to your lines. We show you how to deal with it!

Add a confidence interval to your forecast plot in Python
After the high interest rate of our GGplot shadowing confidence interval with R post, we are sharing as easy as that how to do it properly in Python Plotnine module.
It’s not a trivial issue as long as you need to melt your data in order to achieve a tidy (R tidiverse concept) format. In Python you can easily achieve it both with Pandas and Polars. Once you have this format in your data frame, all you need is to call geom_ribbon().
Plotnine geom_ribbon with Polars dataframe
from plotnine import *
import polars as pl
import numpy as np


np.random.seed(1234)

df = pl.DataFrame({
  "year": range(2000, 2024),
  "value": [np.random.normal(25, 10) for i in range(24)],
  "noise": [np.random.normal(1,3) for i in range(24)],
})

(
  ggplot(
    data=df
  ) + geom_line(aes(x="year", y="value"), color = "#000000bd", size = 1)
  + geom_ribbon(aes(x="year", ymin = "value", ymax = "value + noise"), fill="#0294a55e")
)
## <Figure Size: (640 x 480)>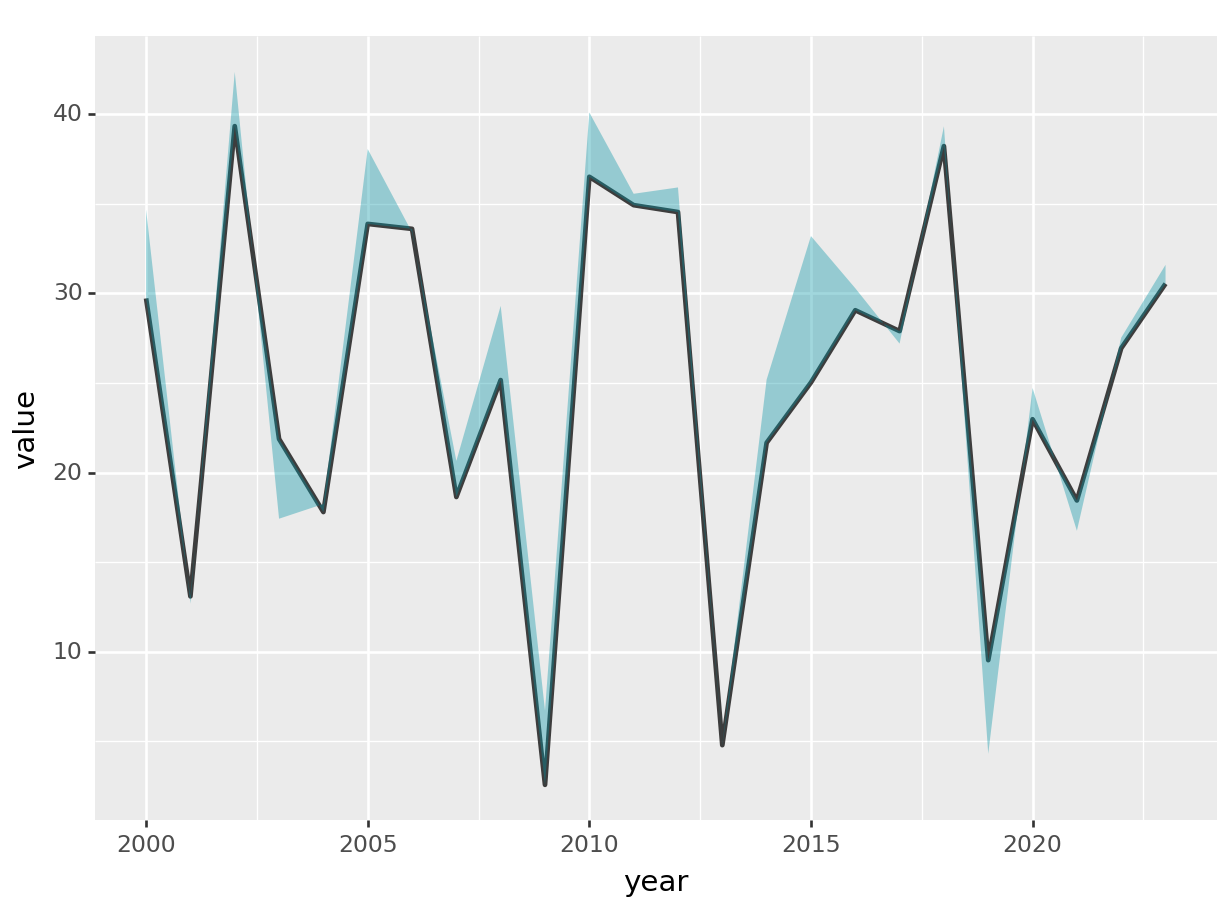
For a multi-line plot in Python Plotnine, yout should include the group and colour aesthetic as follows:
d2f = pl.DataFrame({
  "year": list(range(2000, 2024))*2,
  "group": np.sort(['a', 'b']*24),
  "value": [np.random.normal(i+25, 10) for i in range(24*2)],
  "noise": [np.random.normal(1,3) for i in range(24*2)],
})

(
  ggplot(
    data=d2f
  ) + geom_line(aes(x="year", y="value", group="group", colour="group"), size = 1)
  + geom_ribbon(aes(x="year", ymin = "value", ymax = "value + noise", group="group"), fill="#a59e022e")
)
## <Figure Size: (640 x 480)>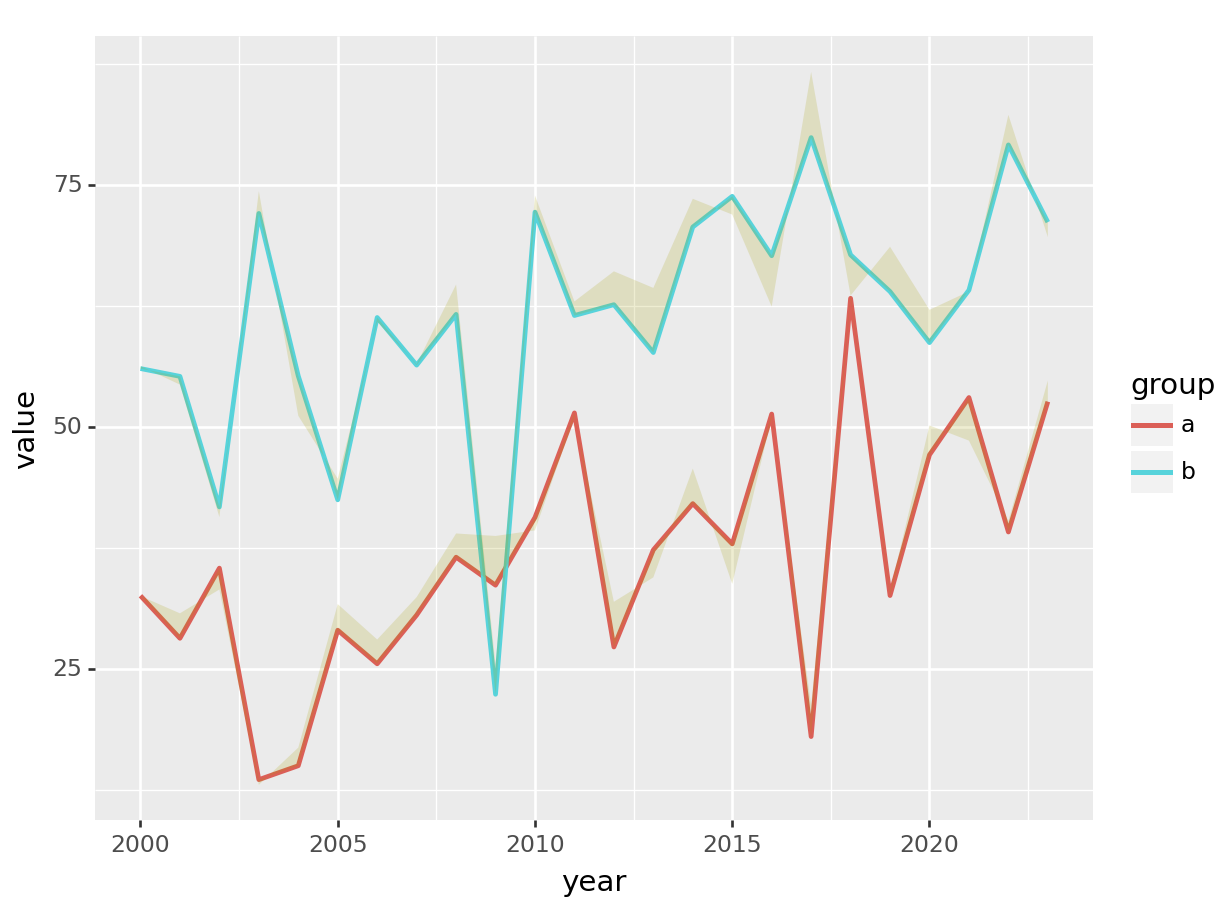
Stay updated on Python tips
Hopefully, this post has helped you become familiar with Plotnine and geom_ribbon function.
If you want to stay updated…
Carlos Vecina
Senior Data Scientist at Jobandtalent
Senior Data Scientist at Jobandtalent | AI & Data Science for Business