Playing with a new R package; Welcome ggcharts!
In this post we are downloading and checking out the new CRAN package ggcharts. A ggplot extension with some cool oneliner plots.
Yesterday I was playing with the new and first Thomas Neitman’s CRAN package!
Its documentation reminded me that more than a year ago Type The Pipe did a talk series about text mining. In one of them, we analized the reviews of the most important spanish banking APPs.
One of the first plots was a lollipop chart showing the ratings in the Play Store, and its deviation from the mean. I used to remember this plot cooler than it actually seems to me lol It’s maybe telling us that we have improved our skills. Hope it.
library(tidyverse)
library(purrr)

# Data Prep
reviews_score <- fst::read_fst("reviews_score.fst")
globalMean <- round(mean(reviews_score$Mean),2)
center_formatter <- function(x) {x + globalMean}   # Set the mean as a center
custom_labs <- labs(title="Ranking Spanish Banking APPs reviews (1 to 5 stars) ",
                    subtitle=paste0("Filtering out reviews without comment. Last week data. The mean score is: ", globalMean),
                    x="",
                    y="Score")


ggplot(reviews_score, aes(x=Bank, y=MeanDev, label=Mean)) +
  geom_segment(aes(x = Bank, y = 0,
                   yend = MeanDev, xend = Bank,
                   col=AboveBelow),size=2)+
  geom_point(stat='identity', aes(col=AboveBelow), size = 14)  +
  guides(colour = guide_legend(override.aes = list(size=2))) +
  scale_color_manual(name="Scoring",
                     labels = c("Above"="Above the mean",
                                "Below"="Below the mean"),
                     values = c("Above"="#00ba38",
                                "Below"="#f8766d")) +
  geom_text(color="black", size=5) +
  coord_flip() +
  theme_minimal() +
  scale_y_continuous(labels=center_formatter) +
  custom_labs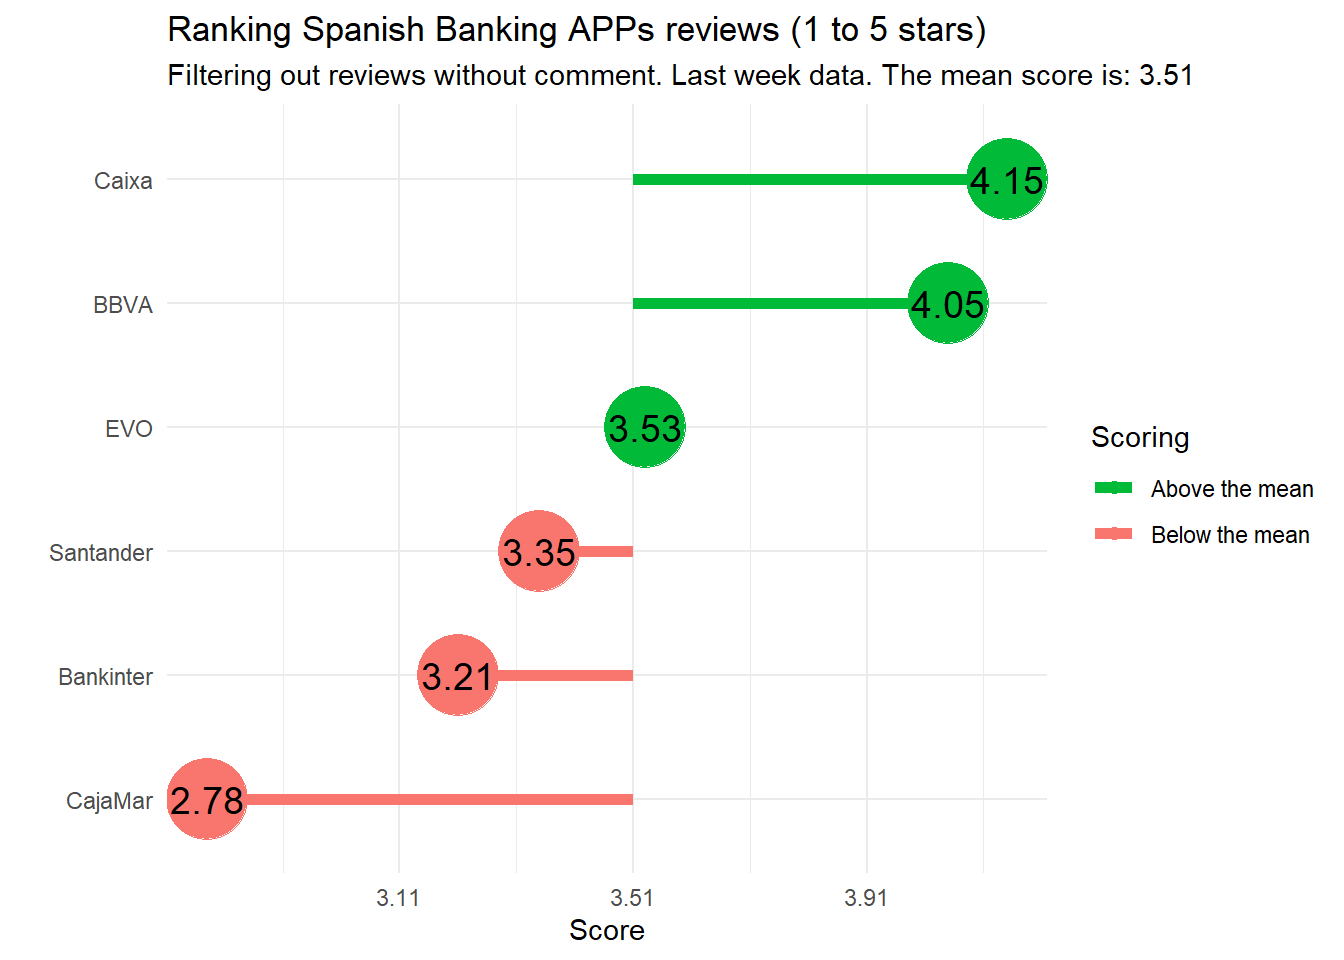
Well, it’s quite good if you don’t pay attention to the big circles or to the long code to write such an “standard” chart.
Here is where ggcharts shines. And it’s only the 0.1.0 version. But having reusable plot templates in a quite flexible way seems such a cool idea for me.
See this three-liner approach to the above plot:
# install.packages("ggcharts") :)
library(ggcharts)

  lollipop_chart(reviews_score, x=Bank, y=MeanDev, color=AboveBelow) +
  scale_color_manual(name="Scoring",
                     labels = c("Above"="Above the mean","Below"="Below the mean"),
                     values = c("Above"="#00ba38", "Below"="#f8766d")) +
scale_y_continuous(labels=center_formatter) + custom_labs 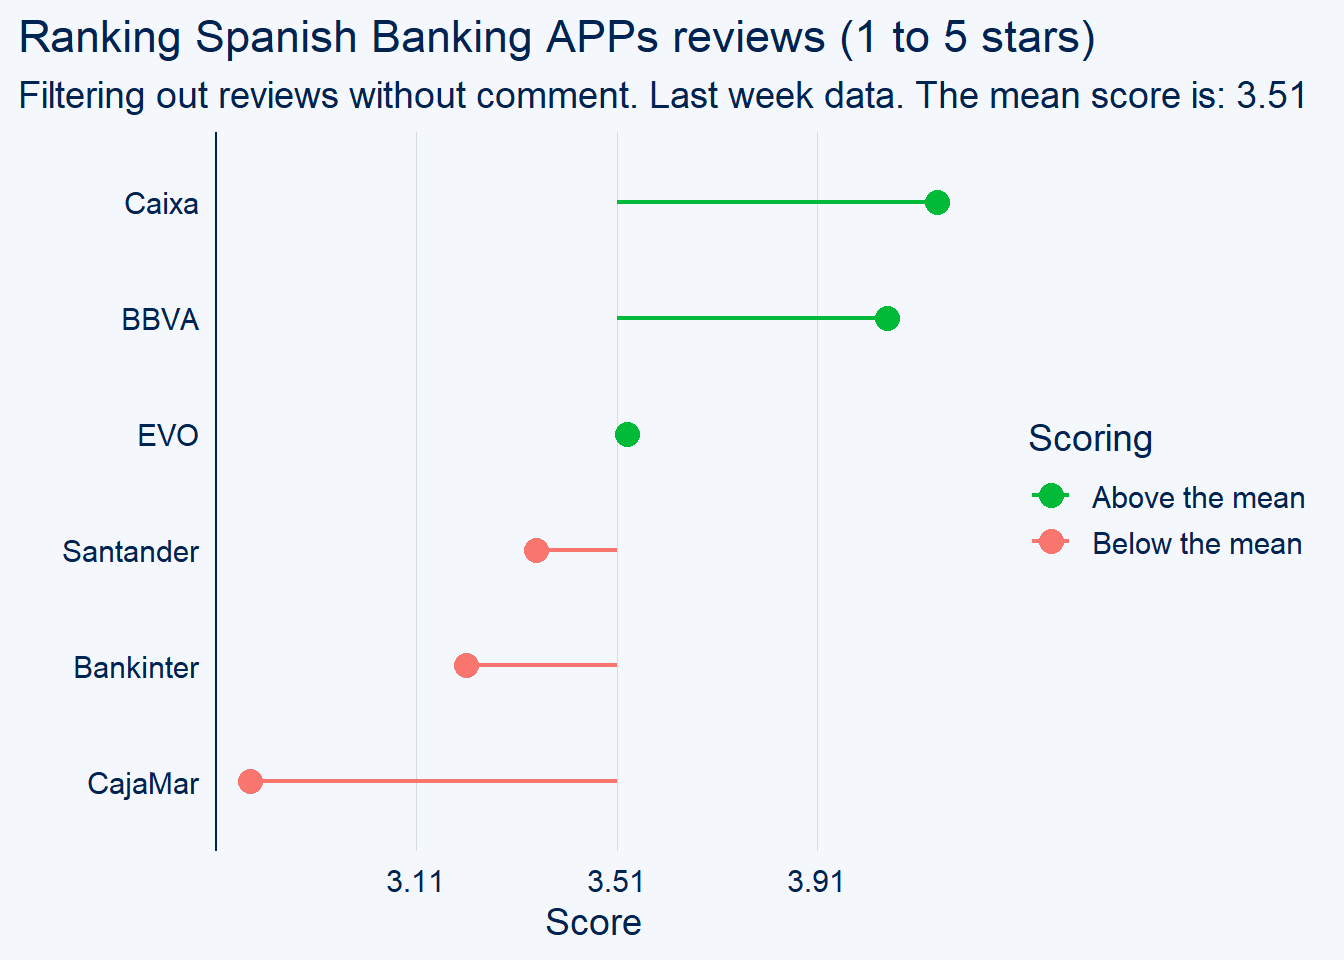
That was so cool and quite much cleaner.
There are several paths to keep improving its capabilities. So here are some possible enhancements. Ask him for yours… see you in his ggcharts repo!
Proposed enhancements to R ggcharts:
- Easy & Quick auto-aligned Annotations:
reviews_score %>%
  lollipop_chart(x=Bank, y=MeanDev, limit = 25, #line_color = colours,
                 highlight = "BBVA",point_color = "blue") +
  scale_y_continuous(labels=center_formatter) +
  annotate("segment", x = 5, xend = 5.3, y = 0.55, yend = 0.7, colour = "black") +
  annotate("text", x = 5.4, y = 0.75, label = "4.05") + custom_labs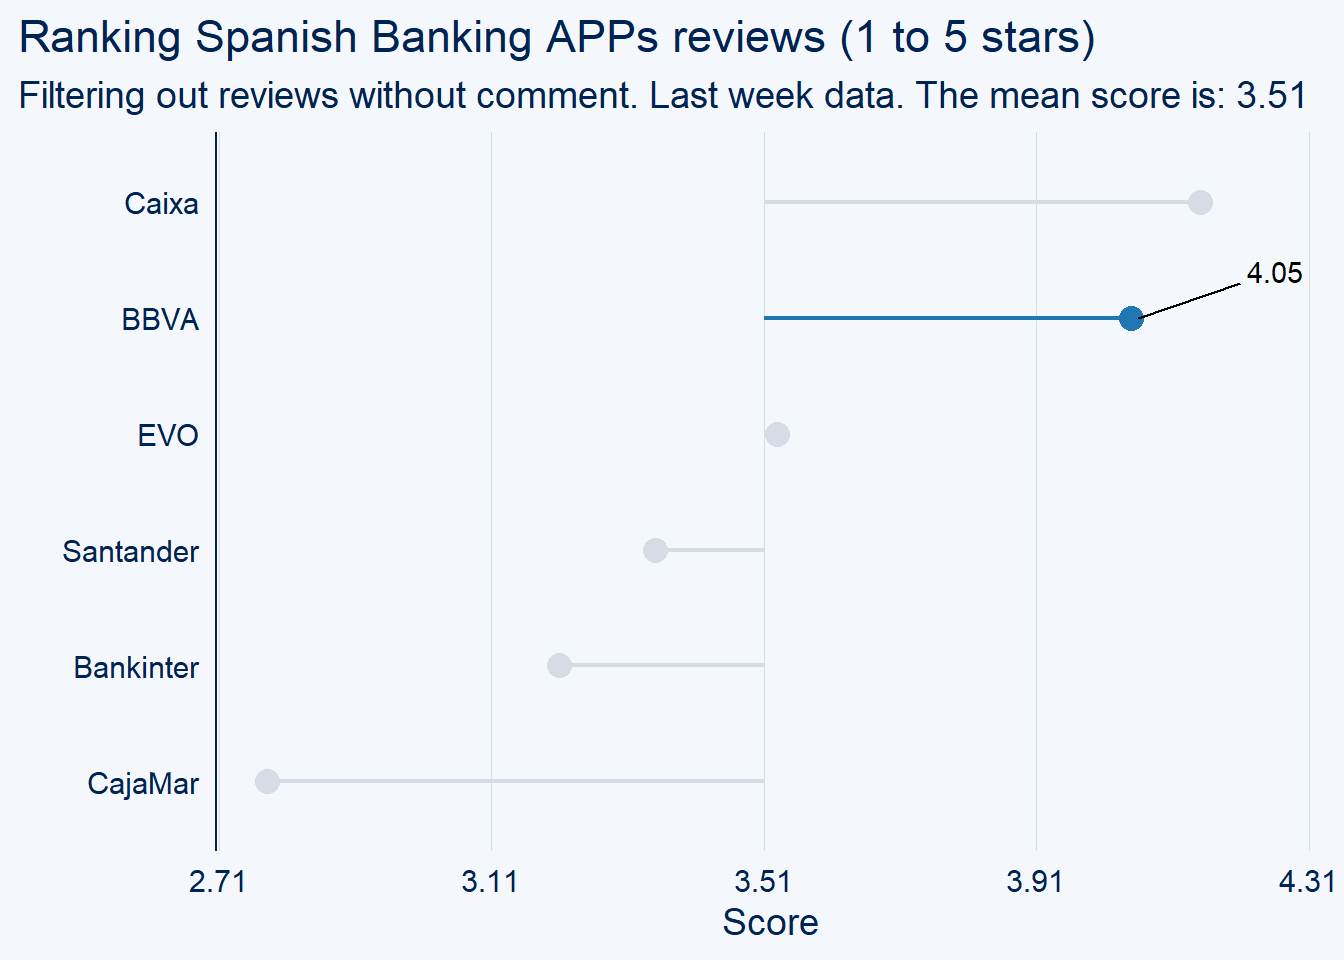
- Easy Image axis and plot insertion:
# https://gist.github.com/jonocarroll/2f9490f1f5e7c82ef8b791a4b91fc9ca
# https://stackoverflow.com/questions/54973129/including-images-on-axis-label-in-an-animated-ggplot2- Non 0 centered in lolliplot and diverging lolliplot:
- Color aes and highlight conflict
# Counter intuitive line_color parameter when highlight
colours <- c("green, green", "green", "red", "red", "red")
lollipop_chart(reviews_score, x=Bank, y=MeanDev, limit = 25, line_color = colours) # BBVA is green
lollipop_chart(reviews_score, x=Bank, y=MeanDev, limit = 25, line_color = colours,
                 highlight = "BBVA") # the highlighting BBVA now red

diverging_lollipop_chart(reviews_score, Bank, Mean) # not working with all positive values (linked with  to center in non 0 value)
Enjoy ggcharts!
Carlos Vecina
Senior Data Scientist at Jobandtalent
Senior Data Scientist at Jobandtalent | AI & Data Science for Business